
Report 2: Sales Amount by Product by Sales Channel by Date
By seeing the sales amount of each channel, sales can know what kind and how much resourse should put into which channel. They could consider which kind of promotion should use in which channel to increase amount. Sales can also know which kind of product should sell by which chanel. Purchase department can forecast the quantity for each chanel.

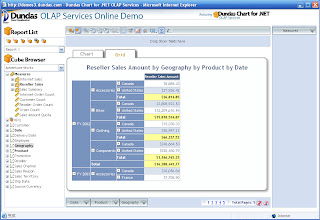
Report 3: Reseller Sales Amount by Geography by Product by Date
According to this report, sales could know what kind of product is more popular in which area. They can plan the promotion and sales project depend on the sales amount of the product according to different area. Purchase can find out how many product sold by particular period and arrange the next order.
Just visiting !
ReplyDeleteThese three reports are fine. You may consider adding variety to your reports by using different measures (aside from sales amount).